This article is part of our The Saber's Edge series.
Recently, Major League Baseball has made batted ball velocity data available. While teams have had the information available for years, an entire two months of data is now available to the public. A few weeks ago, I point out the information is available and a couple of ways to use it (one which I will prove wrong in this article). I am going to dive into the data a little deeper today to put some substance behind these new fancy pants numbers.
I will begin by apologizing for such a generally math heavy post. With the data just becoming available, a basic understanding needs to be established between how the velocity numbers can (or can't) relate to commonly use fantasy categories. I will eventually to get to the meat of each point and label this information as a Major Point.
The first key to the batted ball information is to find if it is predictive of future performance. Usually, years' worth of data is used to find when a stat will stabilize. Sadly, we only have just over two months of information. Some rates can stabilize fairly quickly, like walks and strikeouts. Fastball velocity stabilizes after a couple of pitches. Just because only a small amount is available, doesn't mean an attempt shouldn't made. I went ahead and examined the hitters with more than 30 batted balls in Apr and May. Here is how the values correlate:
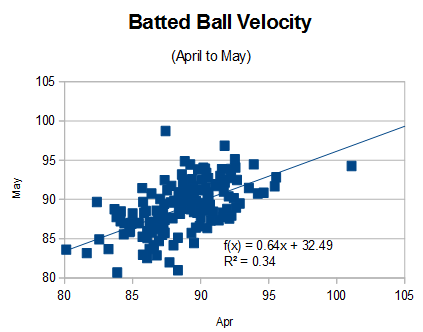
An r-squared of 0.34 means 34% of a player's projected monthly batted
Recently, Major League Baseball has made batted ball velocity data available. While teams have had the information available for years, an entire two months of data is now available to the public. A few weeks ago, I point out the information is available and a couple of ways to use it (one which I will prove wrong in this article). I am going to dive into the data a little deeper today to put some substance behind these new fancy pants numbers.
I will begin by apologizing for such a generally math heavy post. With the data just becoming available, a basic understanding needs to be established between how the velocity numbers can (or can't) relate to commonly use fantasy categories. I will eventually to get to the meat of each point and label this information as a Major Point.
The first key to the batted ball information is to find if it is predictive of future performance. Usually, years' worth of data is used to find when a stat will stabilize. Sadly, we only have just over two months of information. Some rates can stabilize fairly quickly, like walks and strikeouts. Fastball velocity stabilizes after a couple of pitches. Just because only a small amount is available, doesn't mean an attempt shouldn't made. I went ahead and examined the hitters with more than 30 batted balls in Apr and May. Here is how the values correlate:
An r-squared of 0.34 means 34% of a player's projected monthly batted ball velocity can be determined by the previous month's data. For just a couple months of comparable data, this is a fairly strong correlation. Generally, an r-squared value of .5 is needed to say a stats has stabilized and some stats like BABIP take years to stabilize. Truthfully, the batted ball velocity could be stabilize right now since we are over two months into the season, but we don't have another sample to compare it to yet.
Major point: We don't know yet when batted ball velocity will stabilize, but the results so far point to it stabilizing in less than one year.
Now to find which traditional stats correlate with batted ball velocity. While there are quite a few different options, I will concentrate on some fantasy related values.
I will start with batting average. If a player hits the ball hard, they will likely get more hits and therefore raise their average. The common stat to look at here is batting average for balls-in-play or BABIP. By comparing batted ball velocity and BABIP, no strong correlation exists (r-squared of .02). The trend line is in the direction we would expect with BABIP increasing with velocity. It is a 2.3 point increase in BABIP for each MPH changed in average exit velocity. It is just not enough of a trend to help set a player's value.
Major Point: Batted ball velocity by itself does not seem to determine a player's batting average.
Now moving on to home runs. With home runs, I am going to look at the player's HR/FB rate. The results here are little more encouraging. A noticeable correlation exists (R-squared = .36) between the pair. While not a perfect measurement of home run power, some projected HR/FB values can be calculated using average batted ball velocity:
Batted ball velocity: HR/FB
80: -2.6%
81: -1.0%
82: 0.5%
83: 2.1%
84: 3.7%
85: 5.3%
86: 6.8%
87: 8.4%
88: 10.0%
89: 11.5%
90: 13.1%
91: 14.7%
92: 16.2%
93: 17.8%
94: 19.4%
95: 21.0%
96: 22.5%
97: 24.1%
98: 25.7%
99: 27.2%
100: 28.8%
101: 30.4%
102: 31.9%
In order for a hitter to even start to be considered a home run threat, they will need an average exit velocity of at least 82 mph. With the league at an actual 10.8% HR/FB ratio, an average home run hitter needs their average batted ball velocity over 88.5 mph.
Here are some 2015 rookies and how their actual HR/FB% and expected HR/FB% (from batted ball velocities) compare.
Name: HR/FB%, xHR/FB%, Batted ball velocity
Kris Bryant: 12.7%, 11.4%, 88.9 mph
Joc Pederson: 32.7%, 21.2%, 95.2 mph
Steven Souza: 30.6%, 13.7%, 90.4 mph
The one value which sticks out the most is Souza. He may not be able to sustain his performance by hitting the ball as soft as he has.
An issue I can see immediately with the data is if a player, like Souza, doesn't consistently hit the ball hard. Instead, if the conditions are perfect, they can put a charge into the ball every once and while for a home run. I think knowing the player's standard deviation in values along with the average values may be the best way to examine the data in the future. Right now, the average value is the only information available.
Major Point: Average batted velocity can help predict a player's home run per fly ball rate (HR/FB).
Finally, I will move onto Isolated Power (ISO). While ISO is rarely used as a fantasy stat by itself, it can be worked several ways into a player's fantasy profile. ISO can be used as a proxy for overall power, it is part of the category OPS and can help generate Runs and RBI.
The r-squared between the batted ball velocity and ISO is 0.33 and if the player's ISO is adjusted for their running speed the value is 0.36. The r-squares are similar enough that I don't see a reason to go through all the work to speed adjust ISO.
Here is a similar chart of the hitter's projected ISO knowing the player's batted ball velocity.
Batted Ball Velocity: Predicted ISO (player in 2015 with similar ISO for reference)
80: .036 (Freddy Galvis)
81: .050
82: .064
83: .077
84: .091 (Alcides Escobar)
85: .105
86: .118
87: .132
88: .146 (Dustin Pedroia)
89: .159
90: .173
91: .187
92: .200 (Justin Upton)
93: .214
94: .228
95: .241 (Ryan Braun)
96: .255
97: .269
98: .282 (Nelson Cruz)
99: .296
100: .310
101: .323
102: .337 (Giancarlo Stanton)
The power numbers really begin improving as a player see's his average batted ball velocity increase over 90 mph.
Major Point: Average batted velocity can help predict a player's Isolated Power (ISO).
With any new stat, it is tough to figure out the best ways to utilize it. With batted ball velocity it looks like it may stabilize quickly to help determine a player's true talent level. Additionally, it seems to be a good indicator for HR/FB rate and ISO power, but not so withBABIP. I could see some of the preceding values change as more data is generated. Until then, this information can be helpful in getting a hand up on the competition. As always, let me know if you have any questions.