


This article is part of our Baseball Draft Kit series.
GENERATING FANTASY BASEBALL PROJECTIONS is already an arduous process. The unique nature of the 2020 season further compounds the issue. We asked our resident prognosticators Jeff Erickson and Todd Zola to discuss the additional challenges presented by the 60-game schedule.
TODD ZOLA: I had the most trouble deciding on the number of years and weighted average to use as the foundation. Right or wrong, I accounted for most of the other issues mathematically. Even though the number and weighting of the years is "math," and I spent some time trying to determine the right combination, ultimately my process was more empirical than scientific. Not only did I change the weighting, four years of data were used instead of the normal three. Jeff, what caused you the most consternation?
JEFF ERICKSON: Did you choose four years instead of three so that your sample size was larger, or because you wanted to lessen the weight of 2020? For the most part, I stuck with three years, though my general rule of thumb was to include 2017 in instances where the player missed more than a third of the 60-game schedule in 2020. The terms of play were nearly equally concerning to me, however. You've been very transparent about how much the addition of the universal DH changed pitching projections for NL pitchers, so I know how acutely aware you are of that issue. That we don't yet know whether or not that will be employed in 2021 was a huge headache for
GENERATING FANTASY BASEBALL PROJECTIONS is already an arduous process. The unique nature of the 2020 season further compounds the issue. We asked our resident prognosticators Jeff Erickson and Todd Zola to discuss the additional challenges presented by the 60-game schedule.
TODD ZOLA: I had the most trouble deciding on the number of years and weighted average to use as the foundation. Right or wrong, I accounted for most of the other issues mathematically. Even though the number and weighting of the years is "math," and I spent some time trying to determine the right combination, ultimately my process was more empirical than scientific. Not only did I change the weighting, four years of data were used instead of the normal three. Jeff, what caused you the most consternation?
JEFF ERICKSON: Did you choose four years instead of three so that your sample size was larger, or because you wanted to lessen the weight of 2020? For the most part, I stuck with three years, though my general rule of thumb was to include 2017 in instances where the player missed more than a third of the 60-game schedule in 2020. The terms of play were nearly equally concerning to me, however. You've been very transparent about how much the addition of the universal DH changed pitching projections for NL pitchers, so I know how acutely aware you are of that issue. That we don't yet know whether or not that will be employed in 2021 was a huge headache for me. I ultimately decided to project NL pitchers as if they'll be facing the DH again, as I'm cynical enough to consider indications to the contrary as negotiating posture.
The other term of play that created angst for me was the geographical schedule. The results in the playoffs for the Central Division teams highlighted how much the pitchers in the AL and NL Central benefited from the limited schedule, but a look at the team stats also point that out. Whether you sort by advanced metrics like wOBA or wRC+, or a more traditional metric like runs scored, you'll find at least half the bottom 10 teams residing in the Central divisions, and nearly all but the White Sox in the bottom half.
As a result, so many starting pitchers posted career-best ratios, and in some cases by orders of magnitude. It's not just the elite pitchers like Shane Bieber or Trevor Bauer, either. Kenta Maeda's ratios are the poster child for this phenomenon -- his previous career-low ERA was in 2016 (a year we typically don't even use for our projections) at 3.48, his career-low WHIP was heretofore 1.07 in 2019. Yet last year he turned in a 2.70/0.75 combo. Does adding the fourth year go far enough in accounting for the massive sea change, or is a separate adjustment needed? How much do you allow for adjustments of individual outliers like Maeda, or do you, to borrow a golf term, let it play where it lies?
ZOLA: The primary reason I used four seasons was to have the third year of MLEs for minor leaguers in the mix, but I also really toned down the weighting as I used 4:3:2:1, with 4 being 2020. This way, the weighting for the minor-league players is the same as usual. This may seem like I could be overemphasizing the effect of last season, but the reduced number of games softens that. It's a crude way of looking at it, but 4x60=240, 3x162=486 and 2x162=324, so 2019 still has twice as much influence on the weighted average while 2018 has a little more. Normally, I let the engine do the heavy lifting and massage only a handful of players. This season, I've given the personal touch to far more players than ever. Many of the changes have been empirically altering the weighted average for the player, as well as increasing or decreasing the regression on the appropriate stats.
As for the universal DH and geographical schedule, there are two of the factors I handled numerically. With the DH, I went back and adjusted the NL pitching stats for the non-DH years (2017-2019) based on the skills difference between AL and NL pitchers during that span to get a better idea how they may have fared under universal DH conditions. The caveat is not every pitcher would have been affected the same, though that's also true about park factors. Then I just went through the standard process with the adjusted stats for NL pitchers.
Geographical zones wasn't as straightforward since simply ranking the 30 teams by a stat and determining which is better didn't work for last season. The zones were essentially three leagues. It's extreme, but a .350 wOBA in Triple-A isn't the same as a .350 wOBA in MLB. The same is true for East, Central and West. The team stats reflect the difference in the quality of hitting and pitching within each zone. For example, if one of the regions had the best hitting and best pitching, the overall league wOBA would be close to the same for hitting and allowed for pitching. If one region had the best hitting and worst pitching, the delta between the hitting wOBA and pitching allowed wOBA would be huge. That said, there is ample ancillary data to suggest the Central zone was indeed weaker, including how those clubs fared in the playoffs. Any individual series is too small a sample to make that statement, but the number of lost series is enough to confidently declare the Central as weaker. The skills adjustment I incorporated was admittedly more art than science, but it was based on some data from previous seasons as well as 2020.
The other non-scientific factor driving me nuts, and will continue to do so until my last draft, is pitcher innings. Assuming MLB plays 162 games, I have very little feel for how innings will be distributed. Sure, just about everyone will throw fewer, but how many? Will they be skipped in the rotation or come out of games earlier? What about the aces, will they come closer to their norm than others? My gut says some are underestimating the number of innings while I'm overdoing it. To be honest, I think it matters more in draft strategy than projections. My confidence the top tier will throw more innings pushes me to focus more on these horses and less on the middle group, then pound away at the streamers.
Geez, here's me rambling on and on, just like our radio show. I'll let you chime in again.
ERICKSON: I think that your latter factor is really important to address. I started my first Draft Champions League this week, and because there are no free agents in this format, it's especially important to find those horses who will throw a lot of innings, because we won't be able to stream each week. Granted, the extra roster spaces (50-man rosters) essentially replaces the process of streaming, but our degree of precision in identifying who will get those starts diminishes considerably.
Also to that end, I'm looking at the past as a guide. Aaron Nola, who now has a number of 190-plus-inning seasons under his belt, got a little boost in my rankings for this format. Older pitchers generally will get a bump -- not that they're immune from arm injuries, but the odds are a little bit more in our favor that they won't suffer a major arm issue. For that matter, I think that their respective managers will be more inclined to go deeper into games with those pitchers. The class of pitchers that I worry about are those harder-throwing younger pitchers, who I think both are more at-risk of getting hurt and of throwing fewer innings per start. We've seen how the Dodgers have handled Walker Buehler and Julio Urias, for instance. As much as I love their skills, I have to worry a little bit more about their context.
On a related note, I need to spend more time looking at managerial tendencies. Dusty Baker is known for having a slower hook, though I don't think that's been *as* true in his more recent stops and that might just be more with his veteran pitchers. The Rays and Kevin Cash are on the opposite end of the spectrum. But are you going to spend more or less time looking at managerial/ organizational tendencies with your pitcher projections and draft decisions this year? Go ahead and wrap up our discussion, and we'll finish with other specific thoughts in our own separate pieces.
ZOLA: That's a good question, Jeff, and something I've struggled with over the years. Please allow me to mix metaphors, so to speak, but I harken back to when Bill Parcells was the New England Patriots' head coach and had the reputation of being a defensive-minded, ground-and-pound guy until he went to the grocery store and bought Drew Bledsoe. I'd like to think the best managers and coaches adapt to their personnel and take advantage of their strength. However, there are some managerial tendencies independent of that. For example, you mentioned Baker. A.J. Hinch rarely gave his regulars a day off so heading into last season, and I cut back on the playing time of some of the position players since Baker seemed to use his bench more than Hinch.
The Bill James Handbook has a great section on managerial tendencies and I do review it each offseason, trying to unearth an edge and quite honestly, I usually land on feeling the trend was more team-oriented, and let the player's stats do the work. That said, I will look at team tendencies in season and make adjustments. The major thing I look for is stolen-base efficiency. My research has shown teams with 75% or above success rates run more as the season progresses while teams below curtail the thievery. There are exceptions, usually young teams or inexperienced managers.
But yeah, now that next-level analysis has become more commonplace, we need to find another edge while doing what we do, perhaps incorporating more managerial tendency trends is the angle.
This has been fun. Let's stop here and each finish with our own thoughts like you mentioned, talking about what we're going to do when we take off our projections cap and don our drafting cap.
ERICKSON: Typically when I write this article, much of my focus is on the batting environment and how that impacts our category targets. And to be sure, we'll discuss league-wide hitting and pitching stats eventually, and speculate about the liveliness of the ball, but as Todd Zola and I discussed, there are more significant complications this season. We can't simply look at last year's results and multiply by 2.7 (162 games divided by 60 games) to set our targets without adjusting for context. How many games will there be this season? Where will the Blue Jays play? How many playoff teams will there be? Will there be a universal DH again?
As of publication, this latter issue has not been resolved. The projections I've created for RotoWire presume that the universal DH will continue, and that rumblings about the league preparing to go without it represent a negotiating posture, and not what the league wants in terms of its product on the field. What does that mean in terms of the results? It means more playing time is projected for select NL hitters (for instance, think of the logjam that the Padres and Dodgers have among their hitters), and that NL pitchers are projected to have similar ratios to their AL counterparts, and much worse than in 2018 or 2019. If the players and owners can't agree on this issue and we revert back to the AL/NL split on the DH rule, we'll have to make a lot of adjustments accordingly.
I want to highlight one issue that permeated my projection process for the pitchers -- the imbalanced schedule, and how so many Central Division pitchers had career years. It's not just that these pitchers had career years, but to the extent that they improved is remarkable. Here are just a few examples, along with the January NFBC ADP for each pitcher.
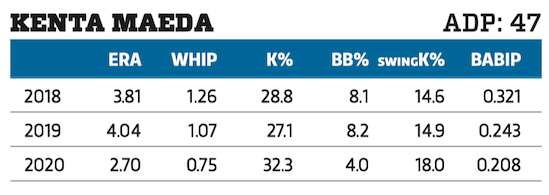
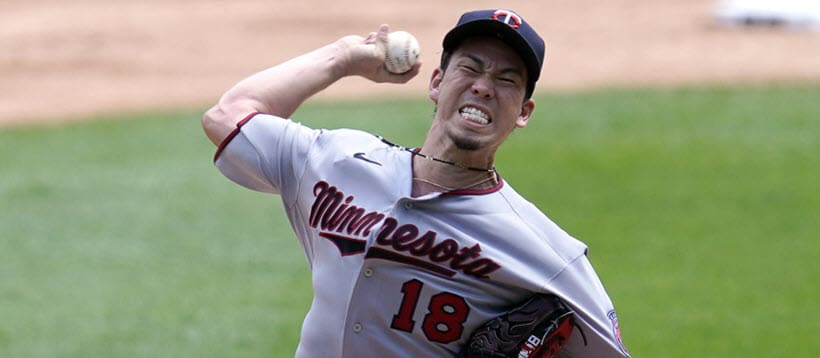
Maeda certainly enjoyed his change of scenery from Los Angeles to Minnesota, and that could explain some of his improvement. He was left in the starting rotation, without his annual forced move to the bullpen. He also changed his pitch mix, throwing his slider 38.6% of the time, up from 31.5% in 2019. That's not a fluke, either -- the Twins routinely encouraged their pitchers to throw more sliders.
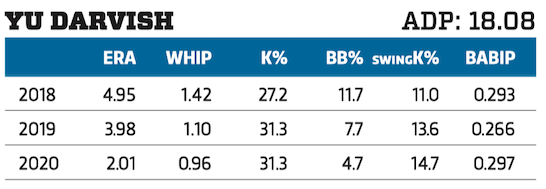
Granted, Darvish's extended strong run began in 2019, so 3.98/1.10 doesn't really represent his true level, but his 2020 performance seems to be at an unrepeatable level.
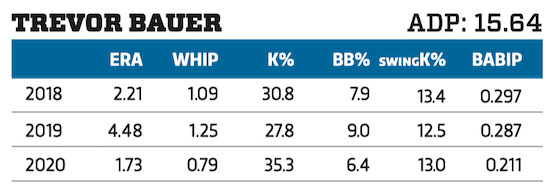
Everything clicked for Bauer with the Reds in 2020, in no small part because he was completely in his comfort zone, thanks to the Reds hiring Driveline founder Kyle Boddy as their Pitching Coordinator and pitching coach Derek Johnson, who actually preceded Bauer with the Reds. Will that dynamic be repeated in his new location?
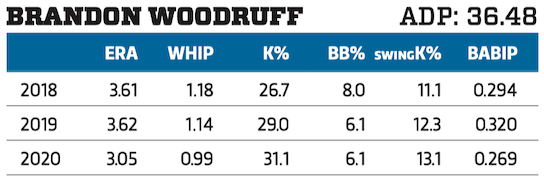
In many of these cases, the pitcher in question has demonstrated a three-year improvement trend, as is the case with Woodruff. One could argue that this was his natural progression, but it's the degree that's so startling to me -- and frequently that's manifested in his WHIP.
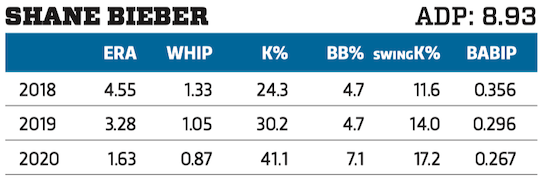
Bieber already was among the top-tier starters to begin with, but obviously he took it to a stratospheric level in 2020. His rough playoff outing was a key data point in the Central Division thesis.
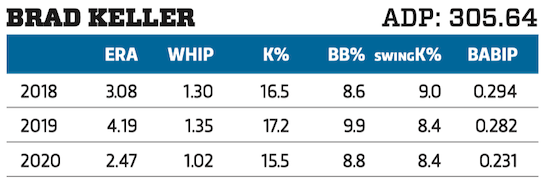
"One of these is not like the other, which one could it be?" Keller doesn't get the strikeouts of these other starters, but look at that huge BABIP drop. The lack of strikeouts explain Keller's lower ADP.
The analysis is a little more complicated for Corbin Burnes (ADP 59.06) and Zach Plesac (60.14), because they have split time between the minors and majors in 2018-19, but they belong in this conversation too.
Why does any of this matter? The 2020 regular season not only was short, cutting down on the opportunity for extreme results to be evened out, but it also was geographically limited. All of these Central Division pitchers faced only Central Division hitters. Of those 10 teams, only the White Sox finished in the top half of the league in runs, wOBA or wRC+. More than half of those teams finished among the bottom 10 in those categories. Moreover, the seven Central Division teams that made the playoffs (Cubs, Reds, Cardinals, Brewers, Twins, White Sox and Indians) all got eliminated in the first round, with many of them struggling to hit. The Reds are still looking to score their first playoff run. Run Joey, run!
We don't know when the season will start, or even when spring training will start, but the presumption is that we'll have a longer schedule in 2021, without the geographical limits to the schedule. That assumption could be challenged -- at publication time we saw a communication from the cities that host spring training sites in Arizona requesting a delay to the start of spring training.
My approach to these outlier seasons was to slightly de-emphasize the 2020 stats for all Central Division starters when running my projection calculations. Normally, the most recent year provides nearly 50 percent of the input on the base projection. It's less than that this year, and in the case of the AL Central and NL Central pitchers, I made it less than 40 percent. If baseball does revert to a similar schedule I'll undo those adjustments.
The result of all of this is that many of my rankings on these pitchers will be below the ADP on them, and in many cases at the low end of that pitcher's range. The ramification of this is pretty clear -- given the choice between Shane Bieber or Jacob deGrom, I'm going to take deGrom. I'll take Aaron Nola ahead of Luis Castillo, and Clayton Kershaw ahead of both Jack Flaherty or Brandon Woodruff. I'm less inclined to dip to another tier of pitchers to avoid the Central Division pitchers, but when presented with like choices, I'm definitely going to use this factor as a tiebreaker.
ZOLA: Despite the challenges Jeff and I discussed, it's our job to generate a set of projections. He handles the official RotoWire version while I'm the point person for ESPN's player expectations. The onus of the drafter is incorporating the nuances of 2021 projections into an effective plan.
Normally, the skill element of different projections is close, with playing time the major difference. That is, batter's slash lines and pitcher's ratios are within reason with the counting stats being higher or lower as defined by playing time. Though, with more data available to aid with regression, the difference in skills between prognosticators is wider than before the Statcast era.
This season, with more uncertainty from last year's 60-game schedule, the normal range of plausible outcomes is wider for everyone. As always, the static player projection should be viewed as a range, but this time the delta between worst case and best case is even greater.
Perhaps more importantly, the small-sample variance inherent to last season's performances introduces more discrepancies between various projectionists. Playing time isn't the primary differentiator this season as the slash lines and ratios also exhibit a broader range among those taxed with doing this for a living.
Donning my drafter's cap, two repercussions of the above stand out, thus shape my draft approach. One is general overall philosophy while the other influences my rankings and road map to desired roster construction.
The wide-open nature of the player pool screams, "Get your guy." Given, average draft position (ADP) is best used as a means of gauging the market relative to your own rankings, the market will be all over the place. While this won't change the ADP, the earliest and latest pick used on several players will be a larger range than normal, hence there is less likelihood a player will be available as suggested by the ADP.
My research has already demonstrated "reach picks," those taken in advance of the ADP, work out significantly more often than "value picks," those drafted after their ADP. The unreliability of the ADP serves to reinforce playing chicken with the room is a poor approach.
The best way to take advantage of the scrambled market is identifying subsets of players and gauging resulting market inefficiencies. Some examples are:
Recency Bias: How much trust is the room putting on unusually high or low levels of 2020 outcomes? Is it the same for underperformers as it is for overperformers? Predetermine those overperformers you consider fact and the fluky underperformers. Based on how the room is handling players of this ilk, you can be more bullish on a few and thus enjoy a tidy pathway to profit.
Adjusting for 2020 Geographical Schedule: As Jeff and I discussed, the quality of the players in the East, Central and West zones is different, affecting performance. Anecdotally, the chief market correction is with pitchers, as many feel Central hurlers faced easier competition, thus their numbers were artificially low. If you deem the penalty is too harsh, there is a buying opportunity. If the room isn't adjusting, Central pitchers are likely picked before your ranking, paving the way for you to select East and West arms you favor more than the market.
Universal Designated Hitter: While this directly applies to early drafts conducted before it is officially known if the National League will use the DH, effects permeate all drafting season. Judging playing time for NL batters is the more obvious repercussion, but if the NL indeed has the DH, the stats of NL pitchers prior to 2019 need to be adjusted as if they faced a DH. The extent the room adjusts tailors their pitching rankings. The less the adjustment, the higher NL pitchers are ranked. Gauging this could serve as an ADP-like guide. If you're close to a wheel and your choice is a batter or an AL pitcher, if your sense is you have AL arms ranked higher, take the hitter first and come back with the pitcher.
With respect to planning a strategy, being fluid is always paramount, but the questions surrounding pitcher workload shape the desired construction of my pitching staff. To be honest, correctly pegging the number of innings thrown by the horses isn't as relevant as identifying those likely to be among the league leaders. On a relative basis, so long as everyone is scaled near proportionally, the projected earnings of the pitcher doesn't change since his stats contribute the same relative to the field.
From my perspective, the top quarter of the pitching pool is more trustworthy than the rest. That said, one of the ways others are combating pitcher variance is not investing on the top tier or two. While this is not altering how the elite are being drafted, it appears to be pushing the next tier down a bit.
In general, the greatest profit potential exists where supply exceeds demand. This pitching dynamic creates a possible market inefficiency since the demand for the lower end of the top 25 percent is lessened, increasing supply while the opposite is true for the middle 50 percent. Since this is where many are focusing, the demand increases, limiting supply.
As such, I want at least three (33 percent) of my pitchers ranked in the top 25 percent. I'm not forcing an ace early but will gladly accept one at a favorable spot. I will attempt to time the market to select three starters among the tier I judge as most reliable and since the lower portion of that group is downgraded by many, the supply is available to pull it off.
The next step involves eschewing the middle tier of starters, though perhaps dipping into the closer pool. I won't be blind to favorable choices in this region, but the chief focus will be batters while others are filling in their SP4-SP6.
The final step entails pounding away at the back end, targeting those with a characteristic rendering them a good streaming option. Perhaps they play in a favorable park so they're good for home games. Maybe they play for a good team, increasing the odds of a win. Many downgrade decent pitchers on bad teams but streaming this group can aid ratios. Finally, the strength of divisions is still a factor with the Central again appearing weaker, so streaming arms from the Central avails more outings facing lesser lineups.
This article appears in the 2021 RotoWire Fantasy Baseball magazine.