This article is part of our The Saber's Edge series.
The baseball season has just passed the season's quarter point. Generally, I try not to make too many decisions on dropping players that I thought were talented before the season started. This week, I am going to demonstrate how I dive deeper into a player's stat line to determine how much of a production change is talent, and how much is luck.
When I look at struggling players, I focus on batting average and home runs/power. Runs and RBI are both reliant upon getting on base and making consistent hard contact. Until a player solves his core hitting issues, he can't expect to just magically have more runs and RBI. A team doesn't move a struggling player to the cleanup spot.
I am going use just stats (and a bit of news searching) to determine if a player's talent has changed. This is not the only way to determine why players aren't producing. One of my favorite ways to get an idea of a player's talent is to watch ~20 of his last plate appearances on MLB.tv. Is the batter making solid contact, but hitting the ball right at defenders? Is the player getting shifted a ton? Is there a ton of swing and miss in his approach? For example, I did this analysis with Mike Moustakas during spring training and noticed better plate discipline and fewer infield flyballs. While he has struggled this season, he is swinging and missing less often, and his infield flyball rate is way
The baseball season has just passed the season's quarter point. Generally, I try not to make too many decisions on dropping players that I thought were talented before the season started. This week, I am going to demonstrate how I dive deeper into a player's stat line to determine how much of a production change is talent, and how much is luck.
When I look at struggling players, I focus on batting average and home runs/power. Runs and RBI are both reliant upon getting on base and making consistent hard contact. Until a player solves his core hitting issues, he can't expect to just magically have more runs and RBI. A team doesn't move a struggling player to the cleanup spot.
I am going use just stats (and a bit of news searching) to determine if a player's talent has changed. This is not the only way to determine why players aren't producing. One of my favorite ways to get an idea of a player's talent is to watch ~20 of his last plate appearances on MLB.tv. Is the batter making solid contact, but hitting the ball right at defenders? Is the player getting shifted a ton? Is there a ton of swing and miss in his approach? For example, I did this analysis with Mike Moustakas during spring training and noticed better plate discipline and fewer infield flyballs. While he has struggled this season, he is swinging and missing less often, and his infield flyball rate is way down.
Understandably, some people don't have the time or the ability to go back and look at game footage. The following is my basic outline of how I evaluate players who are exhibiting a change in production. I will concentrate on struggling players, but the same concepts can be applied to players who are having breakout type seasons.
Batting Average/On-base Percentage
For a player having a decline in batting average (AVG), I look at two stats immediately, strikeout percentage (K%) and batting average on balls in play (BABIP). One or both will be different from the hitter's expected values. The two main keys with BABIP and K% are that extreme BABIPs are unsustainable and K% stabilizes quickly. Back in the middle of April, I highlighted two players ripe for shifts in batting average, and the players' production levels are changing as expected.** Now, we will dive a little deeper than the obvious regression candidates. Finally, all links are to Brad Miller's data as I will reference his struggles as the example.
Starting with K%, I will start looking to see if the hitter's plate discipline has changed, because it can help explain other changes.
1. Start with plate discipline numbers at FanGraphs. Is he swinging more, especially at pitches out of the strike zone and/or is he making more or less contact? Also, is his swinging-strike rate (SwStr%) up or down? A nice rule of thumb is that two times SwStr% equals a player's K%. Brad Miller has seen his K% jump from 15.5% to 26%. He is swinging more at pitches out of the zone (+5% points) and making less contact (-5% points). His SwStr% points to a 23.2% K%, which is higher than expected before the season's start, but not lower than his current level. With the data, I am buying the K% jump.
2. The next place I look is at BrooksBaseball.net's Hitter-At-A-Glance page. It shows how a hitter is struggling against certain types of pitches. A huge red flag for me is a high swing-and-miss rate on fastballs. If a hitter can't hit fastballs, he may be done as a major league hitter. In Miller's case, he is struggling to discern whether non-fastball pitches are in or out of the strike zone.
Moving on to BABIP, I start with batted ball percentages at Fangraphs with an emphasis on GB/FB ratio and line drive percentage (LD%). Additionally, I look to see if the player is feeling the effects of infield shifts.
1. The GB/FB ratio is key to see if a player has changed their approach at the plate, and if they are hitting with more loft. An increase or decrease is not really bad, it is just a trade off. More flyballs are generally going to lead to a lower AVG, but more home runs. In Miller's case, he's hitting more flyballs this season (32% in 2013 to 42% in 2014), so a drop in BABIP would be expected.
2. Next, Miller's line drive percentage, which drives most players' AVG, is down quite a bit. I am not surprised with the decline in Miller's hard contact rate (22% LD% to 15% LD%) since he is chasing more breaking and off-speed pitches out of the strike zone. Even with the drop in LD%, I would expect more than a .194 BABIP. A quick, but not perfect rule, is to add .120 to LD% to estimate a player's BABIP. For Miller, his 15% LD% would be near a .270 BABIP, and he is at only .194.
3. Finally, look to see if the player is either left-handed or right-handed and slow. With teams increasing the infield shifts they use, some players may be seeing the effects on their BABIP. I have published some early season shift data. Currently, Miller is not on that list.
The key is to put all the information together to get a picture of the player. Miller, is swinging at non-fastballs out of the strike zone which has increased his swing-and-miss tendencies, and therefore has led to more strikeouts. Additionally, his contact is not as hard on these pitches, which has led to weaker contact. On top of the weaker contact, he is putting more balls in the air, which will lead to a lower batting average. Even with the expected weaker contact and increase in flyballs, he has been a bit unlucky as more of his batted balls should have been for hits. Overall, Brad Miller's low AVG is expected and for it to turn around, his non-fastball plate discipline needs to improve.
Home Runs
To see if a hitter's home run numbers make sense, a few simple items need to be reviewed. While looking at home runs, I will focus on Domonic Brown, who has three home runs so far this season. At this point last season, he hit eight home runs for a final total of 27.
1. The first key is K% again. A player has to hit the ball for it to be a home run. Just follow the above procedure to find the cause for K% decline. In Brown's case, his K% has dropped from 18% to 17% so it is not simply a contact issue.
2. Another repeat from the factors affecting AVG are GB% and FB%. The lower the number of flyballs, the lower the number of possible home runs. In Brown's case, his FB% has dropped from 34% to 31%; a drop, but not enough to explain the significant drop in power.
3. The next key point to look at is HR/FB ratio. This is where a player could have the most luck involved. A few feet here or there could make a huge difference on the number of home runs hit over the course of a season. While it is the easiest metric to cite with spikes in home-run production, the causes of HR/FB are changes are the most difficult to determine. The first place I go to is the flyball and home run distance leader board at baseballheatmaps.com to get an idea of how far his home runs are going. The next item look at is how much a player is pulling his home runs (the Jose Bautista rule). The outfield corner fences are the shortest distance for a ball to travel for a home run and some player thrive taking advantage of them. To get this information from the last three seasons, FanGraphs has the batted locations available. Finally, I just look over the recent information on injuries or change in plate approach. A small injury could be lingering and a hitter could be playing through the pain, but ultimately sapping their power.
So it is time to step through Brown. His HR/FB rate has dropped from 19% to 5%. OK, we have the main cause behind his drop in home runs. Now to find out why his HR/FB is so low. His home run and flyball average distance is at a four-year low with a drop of 20 feet from last season.
2011: 271 ft
2012: 277 ft
2013: 283 ft
2014: 263 ft
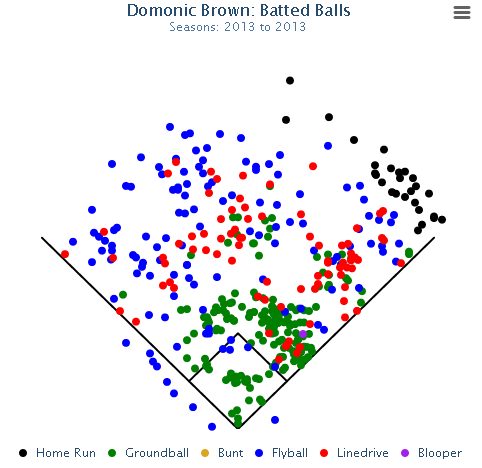
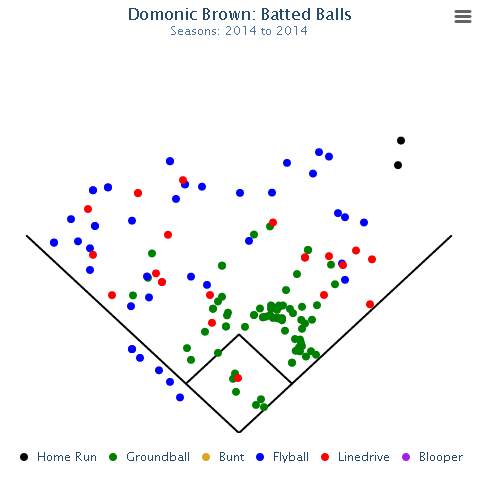
Additionally, he is not pulling the ball enough. Here are his batted ball location from 2013 and 2014.


Still in need of an explanation for the change, I looked into the news and found that pitchers are pitching him away and he's taking the ball to the opposite field more. He is sacrificing power for the hopes of a higher AVG...which is not happening. The change in approach makes sense with the other data we have found. He is still making contact, but for fewer and weaker flyballs to the opposite field.
In Brown's case, a plausible answer exists for an increase or decline in power, but sometimes one doesn't exist. If the only stat visible in decline is HR/FB ratio, it is fine to give the slugger an unlucky tag and expect a turnaround.
Sometimes analysts get lazy and simply give a change in player production a lucky or unlucky label. By doing a quick look at few more advanced stats and news items, an owner can have a good idea of the possible causes for the talent change. As always, let me know if you have any questions.
** Here is how the four players have performed since the original article
Name: AVG on April 16th, Since April 16th
Projected Increase in AVG
Pedro Alvarez: .161, .235
Jhonny Peralta: .188, .271
Projected Decrease in AVG
Everth Cabrera: .333, .210
Khris Davis: .250, .210


