This article is part of our The Saber's Edge series.
In the height of the PED Era, it was not unusual to see players having huge power surges as the played well into their 30s. Times have changed and we just don't see many hitters with huge power gains as they age. This week, we'll look at how power ages and a few older players who have tried to break the mold later in their careers.
In the past, a player's power was assumed to increase as that player ages with a late career drop off. This was true before and during the PED Era (1985-2005). To show this trend, I have created a home run and ISO aging curve for the time frames 1965-1984, 1985-2005 and 2006-2015. I would like to examine some more detailed stats like HR/FB and hard hit data, but those stats weren't collected that far back.
Note: The aging curve was created by the delta method by weighting plate appearances using their harmonic means. With this method, there's a small survivor bias summarized by Mitchel Lichtman at the Hardball Times:
"... survivor bias, an inherent defect in the delta method, which is that the pool of players who see the light of day at the end of a season (and live to play another day the following year) tend to have gotten lucky in Year 1 and will see a 'false' drop in Year 2 even if their true talent were to remain the same. This survivor bias will tend to push down the
In the height of the PED Era, it was not unusual to see players having huge power surges as the played well into their 30s. Times have changed and we just don't see many hitters with huge power gains as they age. This week, we'll look at how power ages and a few older players who have tried to break the mold later in their careers.
In the past, a player's power was assumed to increase as that player ages with a late career drop off. This was true before and during the PED Era (1985-2005). To show this trend, I have created a home run and ISO aging curve for the time frames 1965-1984, 1985-2005 and 2006-2015. I would like to examine some more detailed stats like HR/FB and hard hit data, but those stats weren't collected that far back.
Note: The aging curve was created by the delta method by weighting plate appearances using their harmonic means. With this method, there's a small survivor bias summarized by Mitchel Lichtman at the Hardball Times:
"... survivor bias, an inherent defect in the delta method, which is that the pool of players who see the light of day at the end of a season (and live to play another day the following year) tend to have gotten lucky in Year 1 and will see a 'false' drop in Year 2 even if their true talent were to remain the same. This survivor bias will tend to push down the overall peak age and magnify the decrease in performance (or mitigate the increase) at all age intervals."
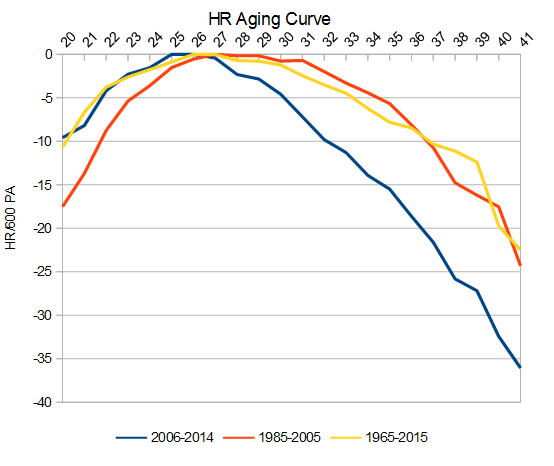
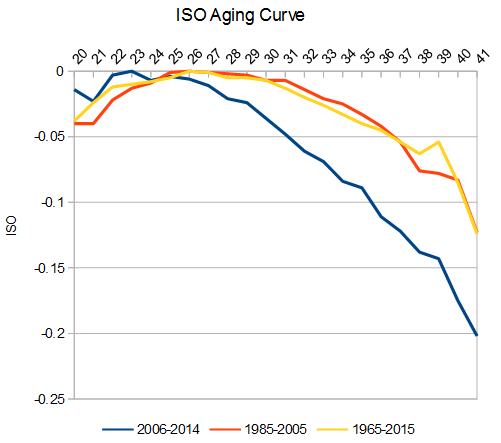
Over the last 10 years, the power aging curves have changed quite a bit. In the PED Era, home runs never really started to decline until age 32. In the current environment, the average hitter begins to see the decline at age 28. ISO, which does a speed component added to it, begins to decline with recent players around age 27 while historically, the average decline didn't happen until they were 32-years-old.
While there will always be some exceptions to the rule for hitters finding late career power, like Jose Bautista, hitters have not been able to keep up their early career home run numbers. For example, here are the 10 leading home run hitters at their age 27 season from the 2006-2008 seasons and how many home runs they hit three and six years later.
| PLAYER | AGE 27 HR | AGE 30 HR | AGE 33 HR |
| Ryan Howard | 47 | 31 | 11 |
| Adam Dunn | 40 | 38 | 34 |
| Matt Holliday | 36 | 28 | 22 |
| Jason Bay | 35 | 36 | 8 |
| Albert Pujols | 32 | 42 | 17 |
| Chase Utley | 32 | 31 | 11 |
| Josh Hamilton | 32 | 25 | 10 |
| Vernon Wells | 32 | 15 | 11 |
| Mike Jacobs | 32 | 0 | 0 |
| Dan Uggla | 31 | 33 | 22 |
Additionally, here are the average and median values for the three time frames.
| AGE 27 HR | AGE 30 HR | AGE 33 HR | |
| Average values | 35 | 28 | 15 |
| Median values | 32 | 31 | 11 |
There was some decline in the first three seasons, but a huge drop-off happened after the player entered their 30s.
The one negative factor that is part of every player's decline is degrading health. Hitters are just going break down more and need longer to recover in the post-PED Era. A factor in almost every old-player breakout involves the player's health degrading and then getting propped back up when they are healthy for a few months. I would be really skeptical of this player maintaining a power breakout late in his career.
Finally, here is a look at a few older players who have had a career power season recently.
Albert Pujols (29 HR in 2015)
I don't think anyone saw Pujols being just one home run shy of 30 before August even started. The main reason for the change is a near career high 21 percent HR/FB ratio. The 35-year-old hasn't put up such a number since 2006 when it was 22.5 percent and he ended the season with 49 HR. While I would like to think he is finally healthy and back to MVP production level, I don't see why the outbreak is occurring.
Here are his stats with the Angels
| YEAR | FB% | HARD HIT% | PULL% | FB DST | HR DST% |
| 2012 | 40 | 34 | 52 | 281 ft | 14 |
| 2013 | 42 | 36 | 52 | 287 ft | 12 |
| 2014 | 35 | 36 | 51 | 274 ft | 14 |
| 2015 | 42 | 34 | 46 | 290 ft | 21 |
I just don't see the improvement that Pujols has made this season. Compare is '13 and '15 seasons. His '13 has same or better numbers besides the final HR/FB rate. I just don't buy the high home rate. I don't think he will fall off in the season's second half, but regress down to the 12- to 14-percent level from his previous few seasons.
David Ortiz (20 HR)
A major flaw fantasy owners make is latching onto early season numbers. Ortiz struggled for the first couple months. At the end of May he was hitting .224 with six home runs. I remember there was some discussion about him being done. I think people may still think he is done, but far from it. In June and July, he has hit 14 HR and has a .262 AVG. If his production had been swapped with the good months before the bad ones, there would be little talk now looking to see if Ortiz is done.
It will be interesting to see if/when Ortiz finally ages since he just seems to continue to hit. Here are his power stats since he turned 35 in 2011.
| AGE | HR/FB% | HARD HIT% | FB DST |
| 35 | 18 | 39 | 295 ft |
| 36 | 20 | 39 | 294 ft |
| 37 | 18 | 45 | 302 ft |
| 38 | 18 | 45 | 297 ft |
| 39 | 19 | 38 | 297 ft |
The 39-year-old is the epitome of consistency, at least with his power. His one output which has really taken a hit the past few seasons is his batting average. It has fallen from .318 to .309 to .263 to .243 the past few seasons. The main reason for the decline has been the number of infield shifts teams have used against him, which at this point is pretty much all the time.
Victor Martinez (6 HR)
Here are the HR/FB% for Martinez over the past four seasons: 7, 7, 16 and 7. One of those numbers is not like the others. He will not have home run numbers similar to 2014 again as he ages. Heck, he never had home run totals close to 32 before (highest was 25 in 2007).
I think his 2015 season will be similar to his future. I think this is what his future will look like this with steps No. 1 and No. 2 being longer and step No. 3 getting shorter and shorter.
- Miss some time on the DL because of an injury
- Struggle when returning from the DL
- Be productive for a while
- Go to step 1